DataMAPt, Inc. Public: MAPt Dashboard The Center of Everything
The first page you'll see when you log into MAPt is the dashboard page. This page is divided into 9 important sections which we have circled and detailed below.
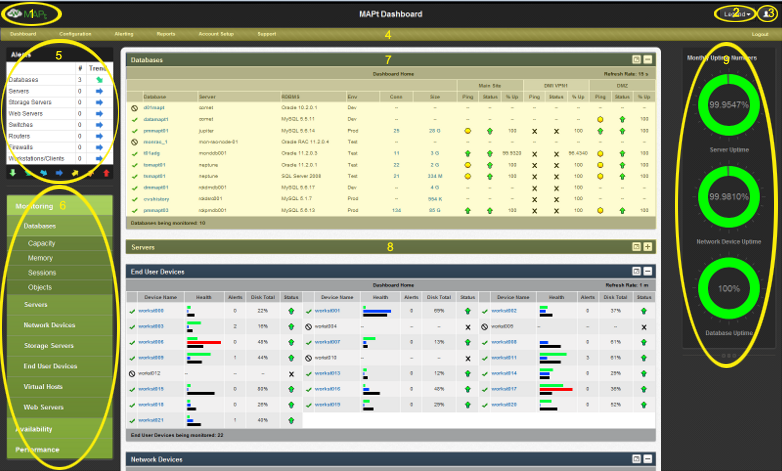
Detailed Dashboard Layout:
1. Branding Logo
This allows a customer to insert their corporate image. If a Managed Service Provider (MSP) is involved then both entities will have images in this area.
2. Legend
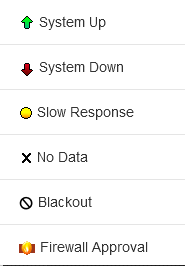
- System Up: There is effective communication with the associated object from the MAPt monitoring service
- System Down: There is no communication with the associated object from the MAPt monitoring service
- Slow Response: Represents when there is latency to this object. This parameter is configurable by the customer.
- No Data: Represents when there is no data to display
- Blackout: Represents when the object has been set by the user not to be monitored, possibly for system maintenance or planned outages
- Firewall Approval: This icon represents when the object has been entered into the system but is not being monitored and is waiting on configuration to be completed
3. Company / User Information
Displays your company name and your user name.
4. Top Menu
This menu is different for each user based on their role. It can display:
- Dashboard - returns the user back to the full MAPt Dashboard page
- Configuration - Add / Modify / Delete which objects are to be monitored, plus other configurable settings
- Alerting
- Problems page - List all Problems that were found by the Alerting System
- Notification Targets - Define who can receive notifications for alerting events
- Rule Definitions - Add, Modify and Delete rules to determine when an alert is raised
- Blackout Events - Disable alerting or monitoring during maintenance or other events
- Reports - Users can choose from many reports based on time and object type
- Account Setup
- Personal Settings
- Company Settings
- Client-side Config
- Change Password
- Support
- Getting Started - Detailed steps to configure monitoring all devices
- Send Feedback - Send Error Reports, requests and feedback
- About MAPt - Version information for all MAPt software
- Logout
5. Alerts Window
This is a summation of all object type alerts and is regularly updated.
The number of OPEN alerts associated with each object type that is being actively monitored is displayed in the '#' column.
The Trend column represents the current direction of NEW alerts based on the average of new alerts over the last 6 hours.
6. Left Menu (M - A - P)
This menu is different for each user based on their role. Each link will update the corresponding Data Window with new data.
The categories are divided into 3 sections:
- Monitoring - All aspects related to daily checks and overall system health
- Memory Usage, Capacity Planning, Active processes and sessions, etc
- Availability - Detailed pages on all areas of availability and uptime
- Complete availability tracking, user access, software installed, etc
- Performance - Critical data to investigate performance issues
- CPU performance, Configuration parameters (including historical tracking), Tuning advice, etc
7. Data Window (Opened)
Displays data for all objects in a particular category. Allows a quick glance at overall performance and key monitoring metrics
Many drill-down capabilities are available on most windows.
8. Data Window (Collapsed)
By pressing the " - " key in the upper right corner of the Data Window, the use can collapse that window.
9. Graph Area
Monthly Uptime graphs for Servers, Network Devices and Databases are displayed.
More graphs will be added in new releases.